Last Updated on: 28th May 2025, 12:45 am
The disproportionate impact of fuel costs on low and middle income populations
High and volatile fuel prices are a key driver of vulnerability in the five European countries considered, disproportionately impacting the middle and low-income groups. Low-income individuals are more likely to drive older, less fuel-efficient vehicles, which consume more per kilometre and leave them especially exposed to rising fuel prices. At the same time, patterns of suburbanisation have pushed many low-income households to city outskirts, where public transport is often limited or entirely absent.
While the majority of Europeans rely on cars for daily mobility, the cost burden of fuel varies widely between households, depending on factors such as geography, vehicle efficiency, and commuting distance. Öko-Institut analysis shows that households in some countries are hit harder than in others. For example, French households that own a car dedicate an average of 6.9% of their total budget to fuel, the highest among the countries analysed. German households spend significantly less, at 4.6%, while Italy (5.7%), Poland (6.0%), and Spain (5.3%) fall in between.
These figures highlight the social inequalities exacerbated by fuel costs within each country. In France, for instance, the four lowest income deciles are particularly affected, with the poorest 10% of households spending an average of 12.7% of their budget on fuel if they own a car. Such disparities highlight the urgency of addressing fuel dependency as a social issue — not just an environmental one.
T&E, based on the Öko-Institut analysis, uses several indicators to identify groups considered vulnerable to rising fossil fuel prices:
-
Individuals aged 18 and above
-
Dependence on private cars
-
Lower income
-
Long commuting distances, often associated with living in rural or sparsely populated areas and limited access to alternative transport modes
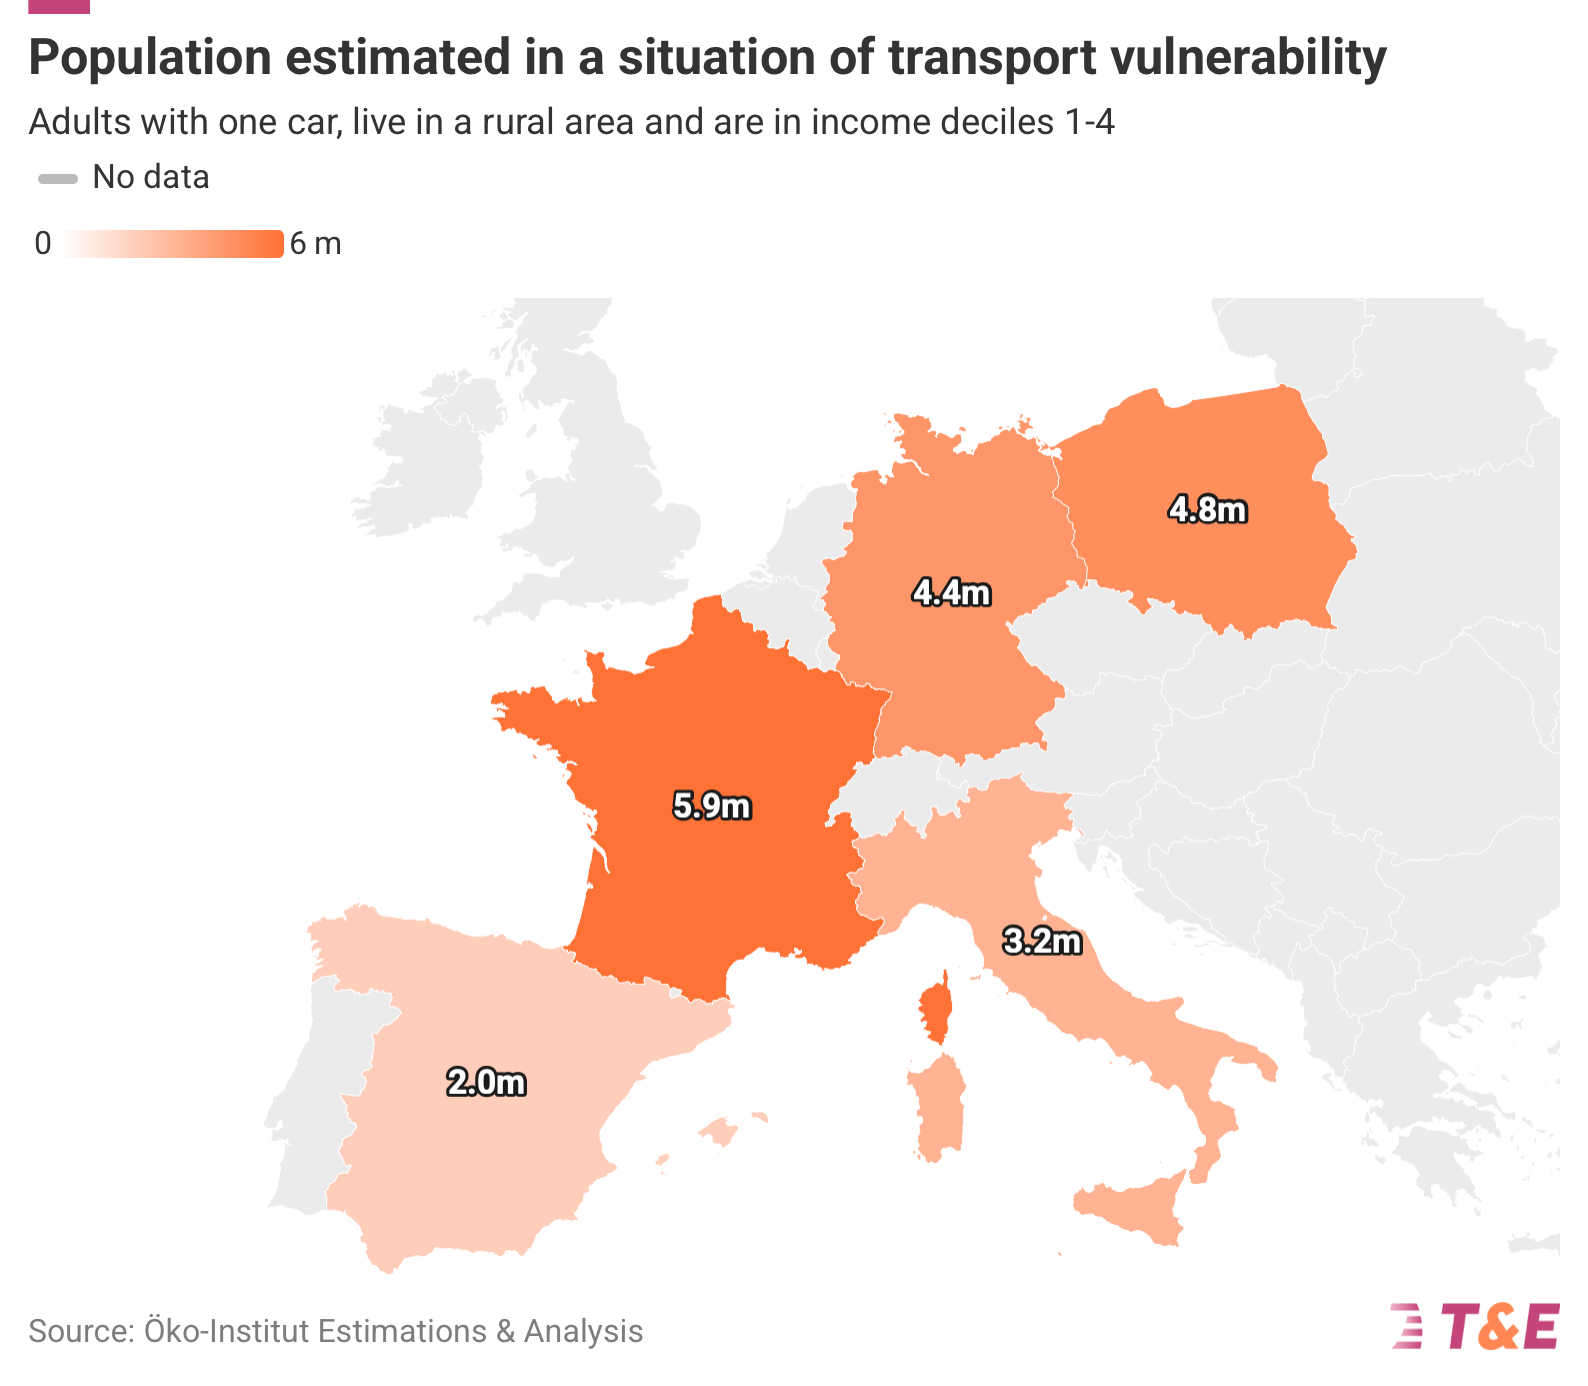
The map below indicates the share of the population which is considered vulnerable, which T&E has defined as adults who own a car, live in a rural area and are in income deciles 1–4. Ranging from 4% in Spain, 5% in Germany and Italy, to 13% in Poland. France, at 9%, is at an intermediate level. Vulnerability reflects here a combination of constraints and risks that affect both a household’s economic situation and its ability to live well. For vulnerable households, the non-negotiable costs of fuel often take precedence over other essential or quality-of-life expenditures, such as recreation, healthcare, or social participation. This leads to renouncement — the foregoing of essential needs and opportunities, such as medical care, employment, or social activities, due to the financial burden of maintaining mobility.
Another indicator is used by Öko-Institut to illustrate the forced renouncement and impacts of transport vulnerability: the Forced Car Ownership (FCO) caused by involuntary car dependence. This situation arises when households, despite financial constraints, are forced to keep a car, cutting back on other critical expenditures like healthcare or leisure in order to preserve basic mobility. As a result, the FCO indicator demonstrates how vulnerability translates into social exclusion, with people sacrificing their well-being to maintain essential mobility.
Since renouncement is a subjective experience—felt differently across households—it is difficult to compare this phenomenon between countries. Nevertheless, the FCO indicator offers valuable insight into the real, lived impact of car dependency in vulnerable households. For example, in France, one in four people has already given up a job due to mobility constraints (Wimoov, 2024).

The high number of vulnerable individuals and the perceived experience of forgoing among households are likely to fuel resistance to change. The implementation of low-emission zones (LEZs) clearly illustrates this challenge.
In 2022, 320 LEZs were already in place across Europe, with more expected to be established by the end of the decade. When mobility restrictions are not accompanied by a deployment plan for alternatives, they are often perceived as limiting access to the affected areas — and to their services — for those driving older, more polluting vehicles, who cannot afford to replace them.
If, in the future, only electric vehicles are allowed to circulate in urban areas, such policies may be seen as unfair, since electric vehicles remain financially inaccessible to many drivers today — particularly those on lower incomes. This situation risks reinforcing a sense of inequality in the face of transition.
Market fluctuations and the geopolitical context are major factors in the variation of fuel prices in Europe. While it would be risky to predict prices precisely for the coming years, it is important to consider that energy prices are generally rising, particularly for motorists. Moreover, the extension of the European carbon market to the transport sector from 2027 will have an impact on fuel prices.
The Emissions Trading Scheme for the transport sector (ETS2)
A new emissions trading scheme, ETS2, has been established as part of the 2023 revisions to the ETS Directive, and will apply to the transport and building sectors. The European Emissions Trading Scheme (ETS) operates on a ‘cap and trade’ basis: a limit is imposed on the total greenhouse gas (GHG) emissions allowed from installations and operators falling within the scope. In the case of ETS2, fuels and heating will be indirectly affected – fuel suppliers, and not final consumers such as households or car users, will be responsible for monitoring and reporting emissions. All ETS2 emission allowances will be auctioned. The cap is reduced each year to align with the EU’s climate targets, giving the signal for a gradual reduction in the EU’s overall emissions.
The Social Climate Fund
Part of the revenues from ETS2 will be allocated to the Social Climate Fund (SCF) to help vulnerable households and micro-enterprises. Member States will have to use the remaining ETS2 revenues for climate action and social measures, and will have to report on the allocation of these funds.
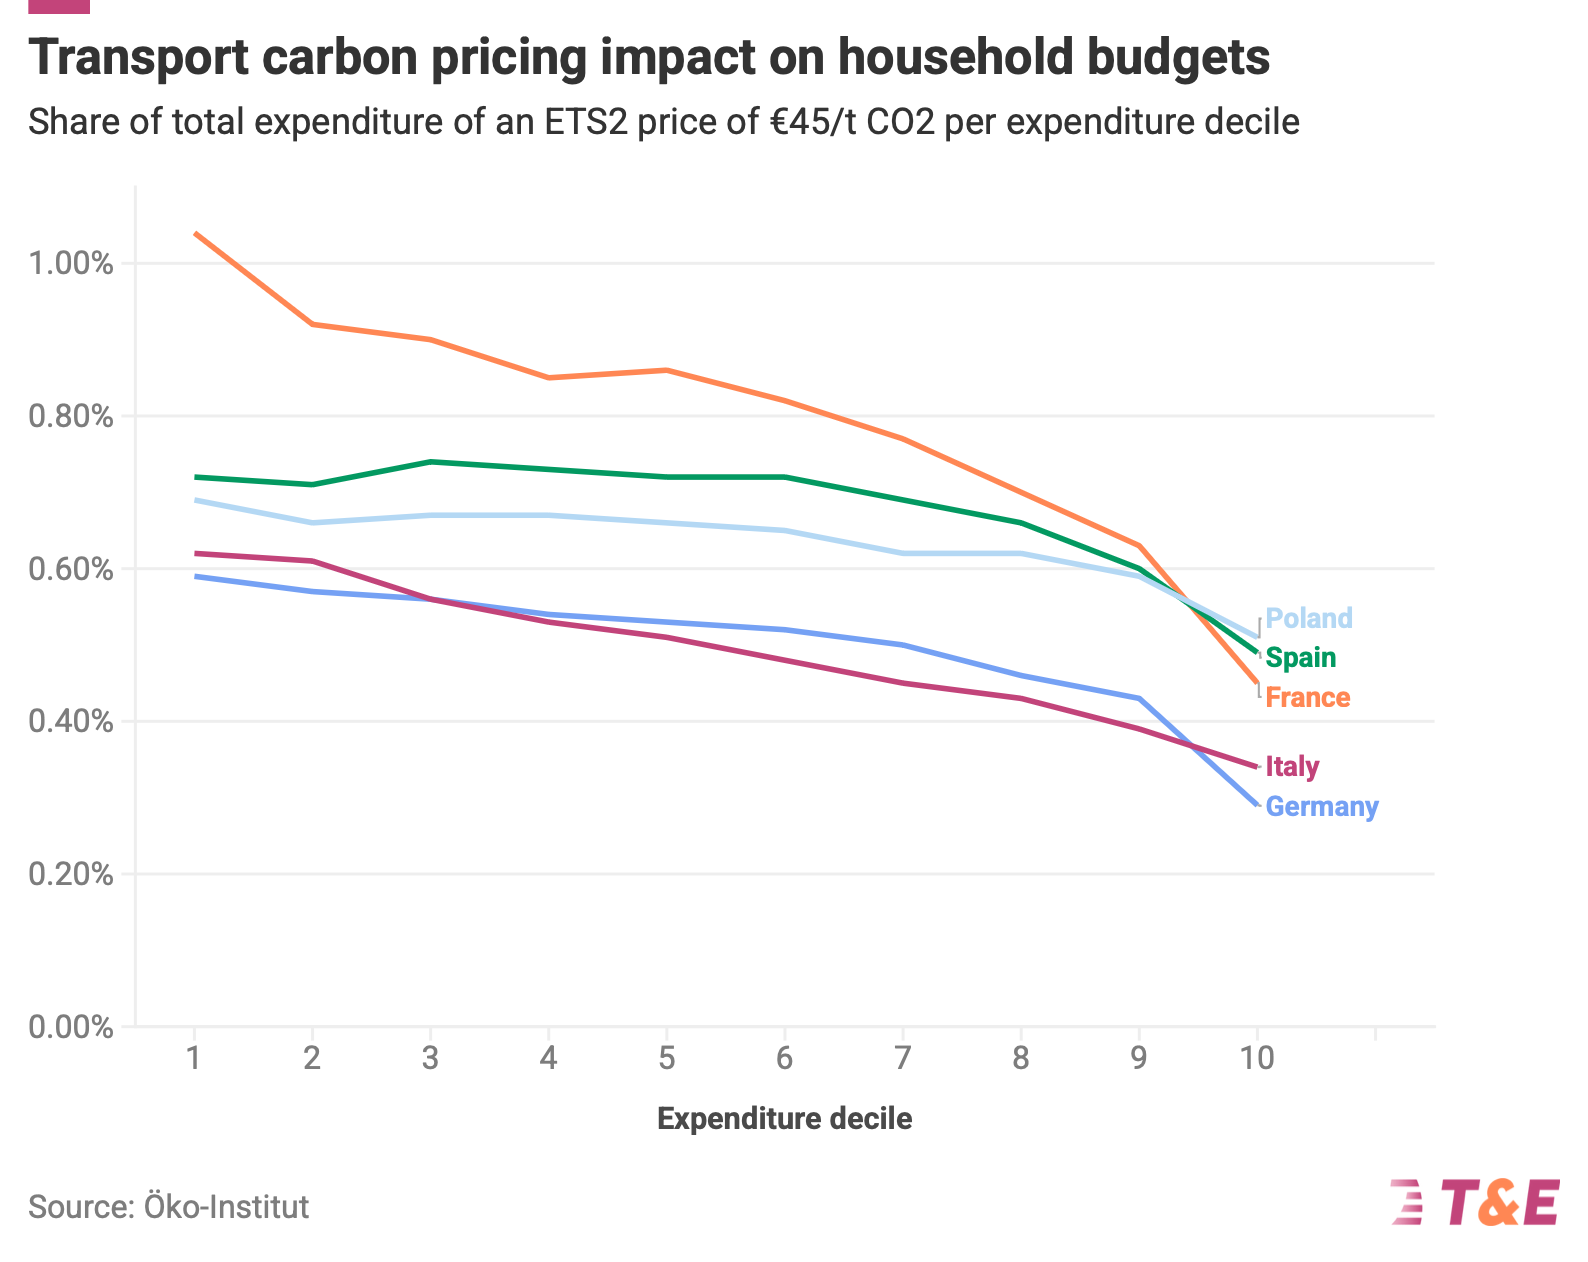
According to scenario-based analyses, the share of average additional household expenditures related to ETS2, at a carbon price of €45 per ton of CO₂, ranges from 0.3% to 1.0%. At €100/tCO₂, it ranges from 0.7% to 2.3%, and at €140/tCO₂, from 0.9% to 3.2%. These additional costs for households depend on fuel consumption levels, which in turn are driven by both the number of kilometers driven and the vehicle’s energy efficiency.
Country-level differences can be explained by factors such as household composition, socio-economic context, and how the automotive market functions. When comparing the distributional impacts across income deciles and countries, lower-income groups are systematically more affected. France stands out as the country with the highest level of inequality in this regard.

France is the country where the risk is particularly high due to the high cost of fuel, followed by Spain and Poland. The figure below shows the impact on fuel prices and the respective weighting according to population income (by deciles): the lower the income, the greater the relative weight of the fuel budget. In this context, the use of petrol or diesel cars will become more expensive, and the additional cost will be even greater for the most vulnerable sections of the population.
Using comparable data across countries for 2015, extrapolated for the period 2027-2032 helps to highlight a trend common to all five countries analysed. However, a more detailed country-level analysis would reveal more specific results that may vary compared to the graph above. In the case of Italy, for instance, the share of fuel expenditure in household budgets is likely underestimated here, suggesting a higher level of social vulnerability than indicated here.
Read the rest of this briefing on T&E website.
Sign up for CleanTechnica’s Weekly Substack for Zach and Scott’s in-depth analyses and high level summaries, sign up for our daily newsletter, and/or follow us on Google News!

Whether you have solar power or not, please complete our latest solar power survey.
Have a tip for CleanTechnica? Want to advertise? Want to suggest a guest for our CleanTech Talk podcast? Contact us here.
Sign up for our daily newsletter for 15 new cleantech stories a day. Or sign up for our weekly one on top stories of the week if daily is too frequent.
CleanTechnica uses affiliate links. See our policy here.
CleanTechnica’s Comment Policy


