
Support CleanTechnica’s work through a Substack subscription or on Stripe.
Or support our Kickstarter campaign!
In my recent article on America’s new maritime plan, I argued that it was competing for the wrong century by anchoring itself to legacy fuels and industrial logic that made sense when gasoline and diesel dominated global energy demand. A reader asked a question regarding the fuel cost variance for electrified and hybridized shipping. I extended that to assume a genuine end game in which road transport is electrified, liquid fuels shrink to aviation and shipping, emissions control areas expand, and carbon pricing becomes material. What do the economics of maritime fuels actually look like in that scenario? That question deserves a careful answer grounded in math, not sentiment.
The right way to compare fuels is not per barrel or per ton of fuel, but per unit of energy delivered to the crankshaft. A modern slow speed two stroke marine engine burning very low sulfur fuel oil (VLSFO) converts roughly 45% to 50% of fuel energy into shaft work. One ton of VLSFO contains about 11.2 MWh of chemical energy. That translates to roughly 5.4 MWh delivered to the crank. That 5.4 MWh becomes the common unit. Electricity in a marine battery drive system delivers about 90% to 95% from battery to shaft. To deliver the same 5.4 MWh at the crank requires about 5.85 MWh of electricity. That conversion removes ambiguity and makes comparisons clean.
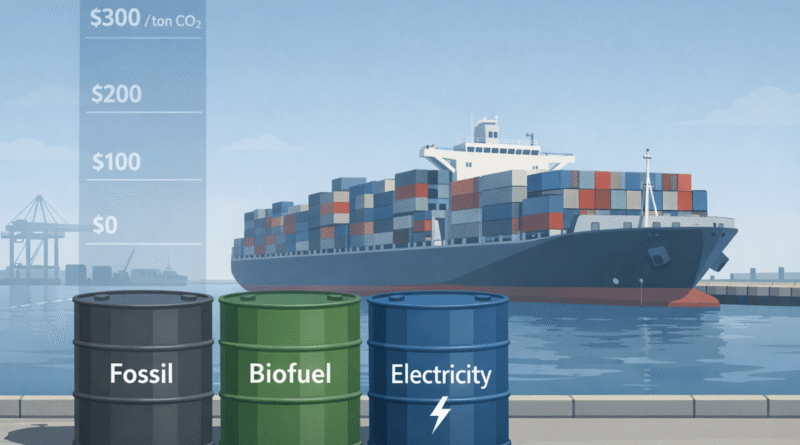
Using that crank equivalent, a global average VLSFO bunker price of $510 per ton translates directly into $510 per 5.4 MWh delivered to the shaft. If we assume an end state fossil uplift of 27% driven by refinery rationalization and declining scale, that price becomes about $650 per ton. At a carbon price of $200 per ton of CO2 and using 3.114 tons CO2 per ton of VLSFO, carbon adds $623 per ton. Add that to $650 and the effective price becomes $1,273 per crank equivalent. At $300 per ton CO2, carbon adds $934, taking VLSFO to $1,584 per crank equivalent. These are not particularly speculative numbers. They are straightforward multiplications.
VLSFO becomes more expensive in the end state not because demand is rising, but because scale is collapsing. Today’s refining system is built around massive gasoline and diesel throughput, which spreads fixed costs across billions of barrels per year and allows residual fuel to be a low-margin byproduct. If road transport electrifies and those volumes disappear, refineries run at lower utilization or shut down entirely. The remaining facilities must recover capital and operating costs from far fewer barrels, raising the required margin per ton. At the same time, upstream oil investment declines in a shrinking industry, pushing up the marginal cost of supply. Shipping and aviation then become the residual demand holders in a smaller, less efficient system. That combination of lower scale, higher per-unit fixed costs, and higher capital risk drives structural price increases for marine fuel even before carbon pricing is applied.
Biofuels slot into this framework as compliance fuels rather than cost leaders. If we assume end game midpoint pricing of $1,650 per crank equivalent for ethanol and $1,850 for biomethanol, they sit above fossil even at $200 per ton CO2 and only approach parity with fossil at carbon prices above roughly $320 to $385 per ton CO2. The break even carbon price for ethanol is found by solving for the carbon price that takes $650 VLSFO up to $1,650. The difference is $1,000. Divide by 3.114 and the result is about $321 per ton CO2. For biomethanol, the difference is $1,200, which implies roughly $385 per ton CO2. Those numbers define the policy regime required for biofuels to win purely on price.
Ethanol and biomethanol are likely to face structurally tight markets in the end state because both depend on finite biological feedstocks that compete across sectors. Global sustainable biomass supply is constrained by land availability, residue collection limits, and ecological boundaries. As road transport electrifies, ethanol loses its gasoline blending anchor, but aviation demand for alcohol-to-jet fuels expands under SAF mandates, quickly absorbing surplus capacity. Biomethanol faces similar constraints, drawing from waste wood, agricultural residues, and industrial byproducts that are constrained, and with methanol in demand by the chemicals and materials markets. Unlike electricity, which scales with grid expansion and generation buildout, biofuel production scales only as fast as feedstock supply and plant construction allow. When multiple sectors compete for limited low-carbon biomass, pricing shifts from cost-plus commodity logic toward marginal decarbonization value. That competition tightens supply and supports higher long-run prices for both ethanol and biomethanol relative to fossil baselines.
Electricity behaves differently because it is not feedstock constrained in the same way. Industrial electricity—the rates I consider most likely to be applied for ship energy—averages around $0.084 per kWh in the US and about $0.091 per kWh in China. Multiply those by 5,850 kWh and the cost per crank equivalent is about $494 in the US and $533 in China. Both are already below fossil at $650 even with no carbon price. In the EU, industrial electricity averages closer to $0.226 per kWh, which implies about $1,322 per crank equivalent. That is above fossil at $650 and slightly above fossil at $200 per ton CO2, but below fossil at $300 per ton CO2. If EU policy drove electricity prices down to 75% of the current average, about $0.17 per kWh, the crank equivalent falls to about $992. At 50% of current average, around $0.113 per kWh, it falls to about $661. Those tariff levers change the competitive landscape more than incremental carbon price changes in many scenarios.
We can already see movements in this regard. Germany has established €0.06 ($0.071) industrial electricity rates due close the spark gap. The EU has just recommended to member states that they lower tariffs and taxes on electricity to reduce the disadvantages compared to fossil fuels, which are often not taxed or tariffed as heavily. While ETS2 coming into force in 2027 will finally price the carbon from burning natural gas for heating and cooking in residential and domestic settings, that’s insufficient. In the long run, as natural gas stops setting the marginal price of electricity at peaks, and hence increasing the average wholesale cost of electricity, more electrons flow across the same more efficiently used grid and low-marginal cost wind and solar set the price point, electricity costs will diminish. Spain’s wholesale price averages have been dropping due to this pattern, and Australia has started giving away three free hours of electricity a day in high-sunlight hours.
The merit order that emerges is simple. Where electrification is operationally feasible, it becomes the lowest cost pathway under most plausible carbon regimes, particularly in the US and China and in a reformed EU tariff environment. Biofuels occupy the next rung for segments that cannot electrify easily. Fossil fuels with carbon pricing remain viable where electricity is expensive or grid constrained. This ordering is driven by arithmetic, not ideology.
Emissions control areas (ECAs) add another layer. ECAs are designated maritime zones where ships must meet stricter limits on sulfur, nitrogen oxides, and particulate emissions than the global baseline. Major examples include the Baltic Sea, North Sea, North American coastal waters, and China’s domestic ECAs, all requiring 0.10% sulfur fuel or equivalent compliance, with the newly approved North-East Atlantic ECA extending tighter controls across much of the European Atlantic seaboard and entering into force later this decade, further expanding the share of global trade routes operating under stringent local air pollution rules.
If we assume 0.1% distillate pricing at roughly $650 per ton in an end state market, that becomes the effective floor for combustion fuels inside ECAs even before carbon. For ships spending significant time in ECAs, short sea feeders and large RoPax vessels in particular, a larger fraction of their annual fuel bill is exposed to that higher cost base. Electricity does not incur sulfur compliance costs and eliminates local NOx and particulate emissions at point of use. ECAs therefore amplify the advantage of electrification in exactly the coastal segments where batteries and shore power are technically viable.
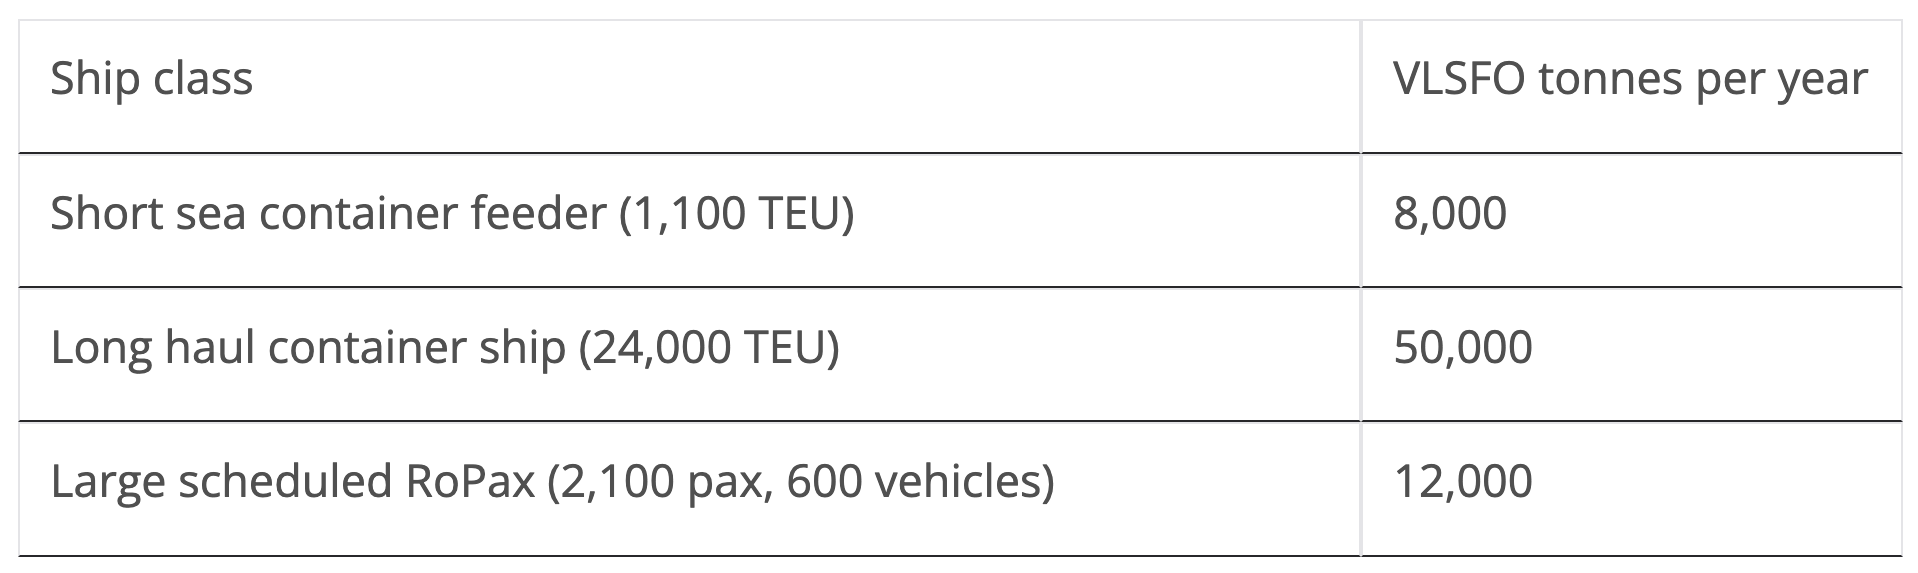
Applying these per unit costs to representative annual fuel consumption clarifies scale. A short sea feeder container ship at 1,100 twenty-foot equivalent unit (TEU) burns roughly 8,000 tons of VLSFO per year. At $650 per ton end state fossil, that is $5.2 million per year. At $1,273 per ton with $200 per ton CO2, that rises to about $10.2 million. At $1,584 per ton with $300 per ton CO2, about $12.7 million. By contrast, the same crank energy delivered by US industrial electricity would cost about $3.95 million per year, and by EU electricity at 75% of current average about $7.94 million. The differences are large enough to support substantial capital investment in batteries and grid connections.
For a 24,000 TEU long haul vessel burning about 50,000 tons per year, the stakes are larger. At $650 per ton, annual fuel is $32.5 million. At $1,273 per ton, $63.6 million. At $1,584 per ton, nearly $79 million. Even modest shifts in per ton pricing move tens of millions of dollars per vessel per year. Biofuels at $1,650 to $1,850 per crank equivalent imply $82.5 to $92.5 million annually for that class of ship. That is manageable for global liner companies only under strong regulatory pressure or freight rate adjustments. It is not a trivial increment.
Hybridization of large vessels deserves more attention because it captures a large share of the economic benefit without requiring full electrification of deep sea routes. A 24,000 TEU ship burning 50,000 tons of fuel per year might spend 10% to 25% of its operating hours inside ECAs or within 200 nautical miles of port. If that fraction of propulsion energy were shifted to battery electric operation, the vessel could avoid the higher effective fuel floor of $650 per ton distillate or scrubber compliance and, under a $200 per ton CO2 regime, avoid roughly $623 per ton in carbon cost for that portion. Even shifting 15% of annual shaft energy, about 0.15 × 50,000 tons × 5.4 MWh per ton equivalent, represents roughly 40,500 MWh of crank energy annually.
At US or China industrial electricity rates of roughly $0.084 to $0.091 per kWh, that energy would cost $3.4 to $3.7 million, compared with $5.0 to $7.0 million if supplied by fossil fuel at end state plus carbon pricing levels. The delta can justify substantial battery capacity sized for port approaches, slow steaming segments, and ECA transits. Hybridization also reduces auxiliary engine use in port, simplifies compliance, and lowers exposure to local air quality regulations. It is not an all or nothing proposition. Even partial electrification of large ships produces meaningful fuel savings, reduces regulatory risk, and creates a bridge between today’s combustion fleet and a more electrified maritime system.
Large scheduled passenger and vehicle RoPax vessels burning about 12,000 tons per year show similar patterns at smaller scale. At $650 per ton, annual fuel is $7.8 million. At $1,273 per ton, $15.3 million. Electricity at US rates would cost about $5.9 million per year for equivalent shaft work. The economics point strongly toward electrification for vessels operating fixed routes with predictable port calls and high time in ECAs.
When fossil demand collapses to aviation and shipping, the refining system shrinks. Lower throughput means higher fixed cost per barrel and higher required margins to sustain capital investment. An uplift from $510 to $650 per ton VLSFO is a reasonable midpoint estimate in that environment. Jet fuel sees similar or slightly larger percentage increases because refineries must optimize for middle distillates without gasoline cross subsidizing overhead. These structural uplifts mean fossil fuels do not become cheaper in a low demand world. They become less efficient to produce.
In my technoeconomic assessments, fully synthetic fuels built from green hydrogen and captured carbon simply do not enter the economic equation for maritime propulsion because their cost structure remains structurally higher than biologically derived fuels. Even assuming very optimistic green hydrogen manufacturing costs of $2 per kg, the energy input alone implies more than $120 per MWh before synthesis, compression, storage, and capital recovery are added. Once full conversion losses and plant financing are included, synthetic methanol or synthetic diesel equivalents routinely land in the $250 to $400 per MWh range of chemical energy. By comparison, scaled biomass-derived ethanol and methanol in end-game scenarios cluster closer to $120 to $200 per MWh. That means synthetic fuels are typically two to three times the cost of biofuels on a delivered energy basis. When translated into crank-equivalent propulsion cost, they sit far above both biofuels and electricity in every reasonable carbon price scenario examined. For maritime applications where fuel cost dominates operating expense, synthetic fuels remain a compliance backstop rather than a competitive primary pathway. Similarly, delivered liquid hydrogen costs are also prohibitive compared to clear and present alternatives.
The combined picture suggests that carbon pricing alone does not guarantee a transition to biofuels. It raises fossil costs, but unless carbon prices exceed $320 to $385 per ton CO2, biofuels remain more expensive than fossil on a crank equivalent basis. Electricity policy reform in high cost regions can change the competitive order faster than raising carbon from $200 to $300 per ton CO2. Emissions control areas reinforce this dynamic by raising the effective combustion fuel floor in coastal waters.
For policymakers, the implications are direct. If the objective is rapid maritime decarbonization in short sea and coastal segments, lowering electricity tariffs at ports and accelerating grid connections is likely more effective than marginal increases in carbon price. If the objective is deep decarbonization of long haul shipping using biofuels, mandates or fuel standards will be required because price signals alone are unlikely to reach the necessary level. For operators, the numbers argue for segment specific strategies. Electrify where you can. Improve efficiency and consider compliance fuels where you must. Treat fossil as a shrinking and structurally more expensive system rather than a stable baseline.
The question raised in response to the earlier article was whether America’s maritime plan was misaligned with the century it is entering. Looking at the math, the answer depends less on rhetoric and more on whether policy aligns with the merit order embedded in these numbers. The 21st century maritime fuel system will be shaped by crank equivalent costs, carbon pricing, ECAs, and electricity tariffs. Plans that ignore those constraints risk competing with arithmetic rather than with rival nations.
Support CleanTechnica via Kickstarter

Sign up for CleanTechnica’s Weekly Substack for Zach and Scott’s in-depth analyses and high level summaries, sign up for our daily newsletter, and follow us on Google News!
Have a tip for CleanTechnica? Want to advertise? Want to suggest a guest for our CleanTech Talk podcast? Contact us here.
Sign up for our daily newsletter for 15 new cleantech stories a day. Or sign up for our weekly one on top stories of the week if daily is too frequent.
CleanTechnica uses affiliate links. See our policy here.
CleanTechnica’s Comment Policy