
Support CleanTechnica’s work through a Substack subscription or on Stripe.
We briefly covered the news this month that electricity from solar power surpassed electricity from coal power in May. This is the first time the US ever got more electricity from solar than from coal across a full month. But let’s take a closer look, also sharing a great graph created by Ember.
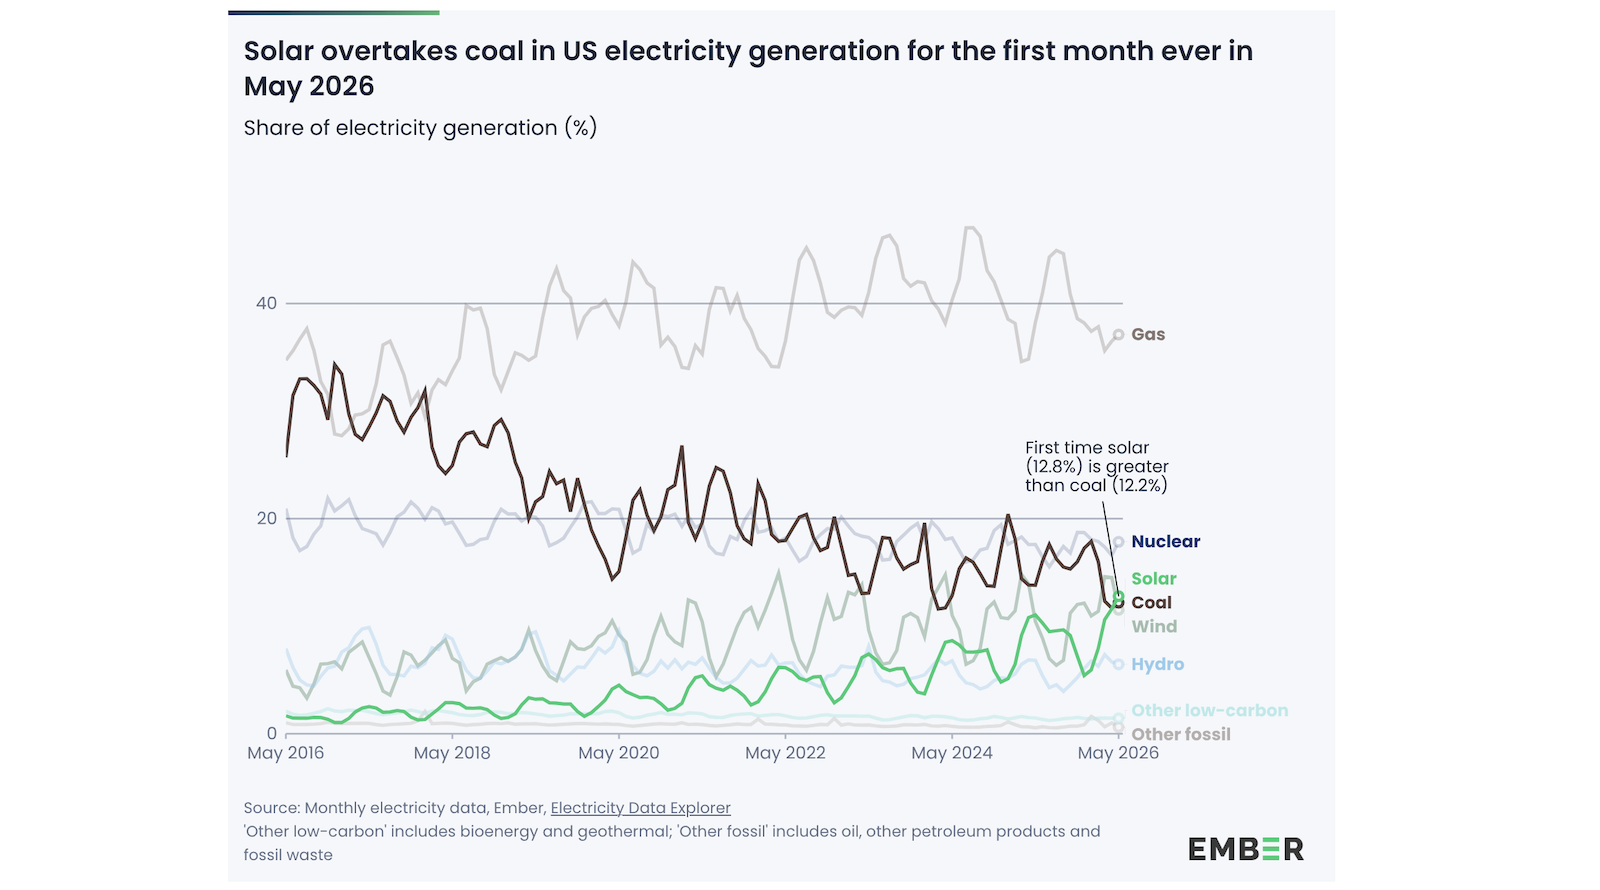
For those of you who read CleanTechnica 10–15 years ago, you may remember the monthly US electricity generation and capacity reports I created back then. It was always fun seeing the growth of wind and solar power, which eventually came to absolutely dominate new power capacity in the country. However, change in electricity generation was so slow, and electricity from solar power was so tiny. But the trends were clear, and they would only lead one way. Now, we can see that solar has passed that historic marker of creating more electricity for the country than coal. Solar provided 12.8% of the US total, while coal provided 12.2%.
As the graph below shows, coal power has declined for years as it has gotten less and less competitive. At the same time, solar power has risen for years. There are clear seasonal variations, so we can expect coal to generate more electricity than solar again later in the year, but for the next few months or so, solar electricity should exceed coal electricity. In fact, it’s also climbing close to nuclear electricity!
“In May 2026, solar generated an all-time high total of 45.5 TWh, exceeding output in May 2025 by 17% and surpassing the previous record set in July last year,” Ember writes. “This record could be broken again in the coming summer months. While total solar output typically peaks in June or July, its share of the electricity mix is often highest in April or May, when strong solar output coincides with more moderate demand before summer cooling needs increase. In May, solar also became the third-largest source of electricity in the US, behind gas and nuclear.” The third highest source of electricity in the USA! Who could have imagined that a decade ago? (Other than us I mean.)
Overall, combining renewable energy sources, they are looking very good.
Coal was down 11% year over year. “The share of coal generation in the US mix has nearly halved in the last five years, falling from 19.7% in May 2021 to 12.2% in May 2026. In contrast, solar power’s share of the mix more than doubled from 5.4% to 12.8% over the same period.” What a change the past five years has brought. Maybe I stopped doing my monthly reports a bit too early. But it did feel like watching paint dry for a while there.
“US solar power continues to set new records. Overtaking coal for the first month on record shows just how far solar has come, from a niche contributor to the third-largest and fastest-growing source of power in the US electricity system,” said Nicolas Fulghum, Senior Data Analyst at Ember. “From Texas to California, markets across the US are betting on solar to meet rising power needs.”
Indeed.
Related story: Electricity Generation from Solar Could Exceed Coal in ERCOT for the First Time in 2026
Sign up for CleanTechnica’s Weekly Substack for Zach and Scott’s in-depth analyses and high level summaries, sign up for our daily newsletter, and follow us on Google News!
Have a tip for CleanTechnica? Want to advertise? Want to suggest a guest for our CleanTech Talk podcast? Contact us here.
Sign up for our daily newsletter for 15 new cleantech stories a day. Or sign up for our weekly one on top stories of the week if daily is too frequent.


CleanTechnica uses affiliate links. See our policy here.
CleanTechnica’s Comment Policy